The Location View
The Location View gives you a detailed picture of weather conditions at a single monitored location. Navigate to it by clicking any location on the map or in the locations table.
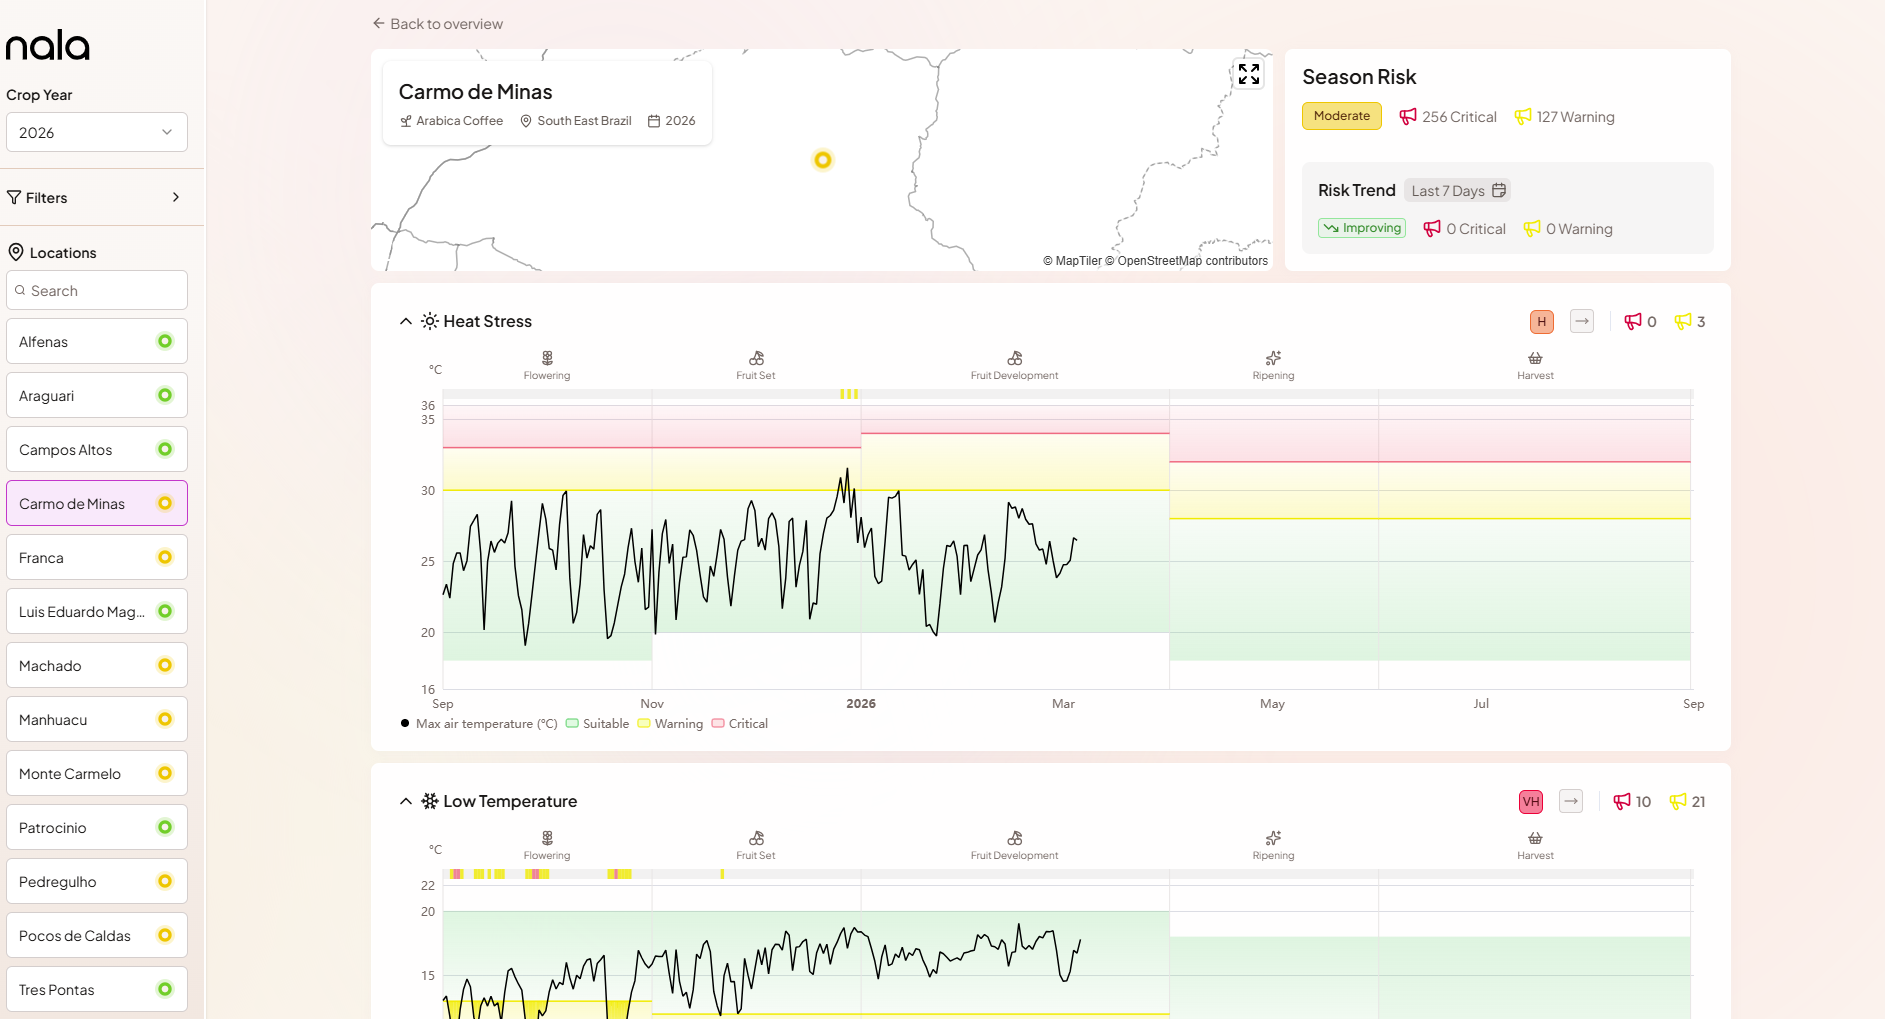
At the top of the view, the location name, crop, region, and crop year are shown alongside a small map placing the location in geographic context. To the right, the Season Risk card shows the overall Season Risk Level and alert counts for this location, and the Risk Trend card shows how risk has changed over a recent period (adjustable window, defaulting to the past seven days).
Hazard charts
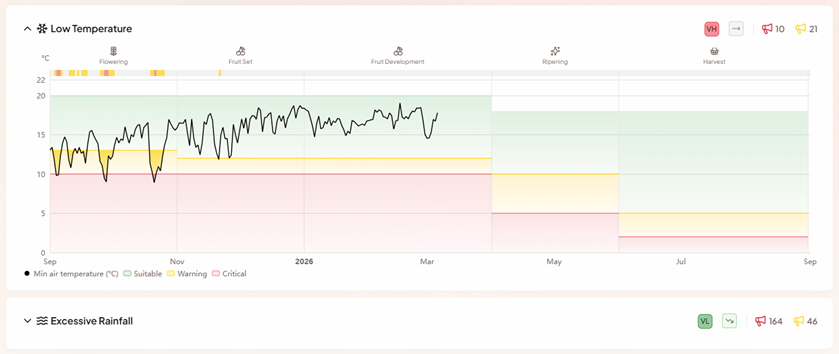
The main content of the Location View is a set of dedicated charts - one for each monitored weather hazard (Heat Stress, Low Temperature, Excessive Rainfall, Drought). Each chart shows the actual weather metric as a time series: temperature in °C, precipitation as a rolling sum in mm, soil moisture in m³/m³.
Within each chart, horizontal coloured bands show the Warning and Critical threshold zones for the current growth phase. These bands shift at phase boundaries - the phase labels are shown along the top of each chart, so you can immediately see what part of the crop cycle you are looking at and how conditions compare to the thresholds that apply at that stage.
Each hazard section also displays its individual Season Risk Level badge and the cumulative count of Critical and Warning alerts for the season to date. This makes it easy to see at a glance which stressors are driving the overall risk and which are within normal range.